
Industry Sector Emissions
Total Emissions in 2022 = 6,343 Million Metric Tons of CO₂ equivalent. Percentages may not add up to 100% due to independent rounding. Land Use, Land-Use Change, and Forestry in the United States is a net sink and offsets 12% of these greenhouse gas emissions. This net sink is not shown in the above diagram. All emission estimates are sourced from the Inventory of U.S. Greenhouse Gas Emissions and Sinks: 1990–2022.
On this page:
- Sources of Industry Sector Emissions
- Industry Sector Emissions Trends
- Reducing Emissions from Industry
Sources of Industry Sector Emissions
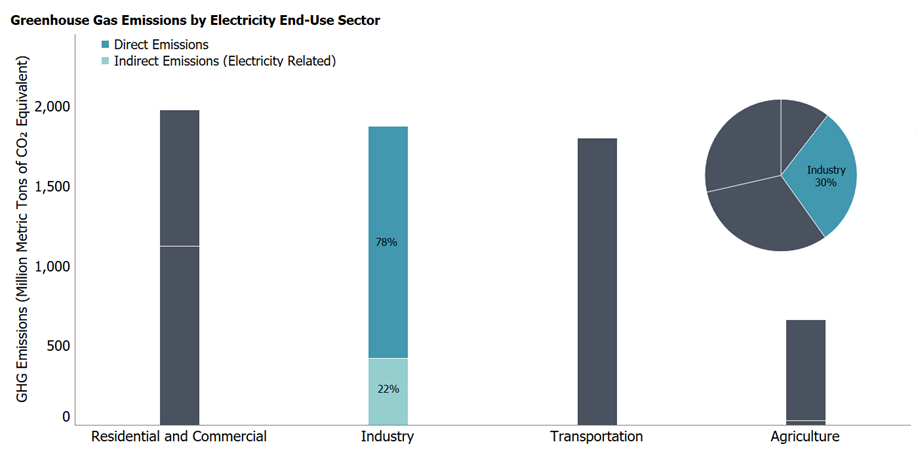
The industry sector produces the goods and raw materials we use every day. The greenhouse gases emitted during industrial production are split into two categories: direct emissions that are produced at the facility, and indirect emissions that occur off site but are associated with the facility's use of electricity.
- Direct emissions are produced by burning fuel for power or heat, through chemical reactions, and from leaks from industrial processes or equipment. Most direct emissions come from the consumption of fossil fuels for energy. A smaller amount of direct emissions, roughly one third, come from leaks from natural gas and petroleum systems, the use of fuels in production (e.g., petroleum products used to make plastics), and chemical reactions during the production of chemicals, metals (e.g., iron and steel), and minerals (e.g., cement).
- Indirect emissions are produced by burning fossil fuel at a power plant to make electricity, which is then used by an industrial facility to power industrial buildings and machinery.
More information about facility-level emissions from large industrial sources is available through EPA's Greenhouse Gas Reporting Program data publication tool. National-level information about emissions from industry as a whole can be found in the sections on Fossil Fuel Combustion and the Industrial Processes chapter in the Inventory of U.S. Greenhouse Gas Emissions and Sinks.
Industry Sector Emissions Trends
- In 2022, direct and indirect industrial greenhouse gas emissions accounted for 30% of total U.S. greenhouse gas emissions, making it the second largest contributor of greenhouse gas emissions of any sector.
- Direct greenhouse gas emissions from Industry account for 23% of total U.S. greenhouse gas emissions, making it the third largest contributor to direct U.S. greenhouse gas emissions, after the Transportation and Electric Power sectors.
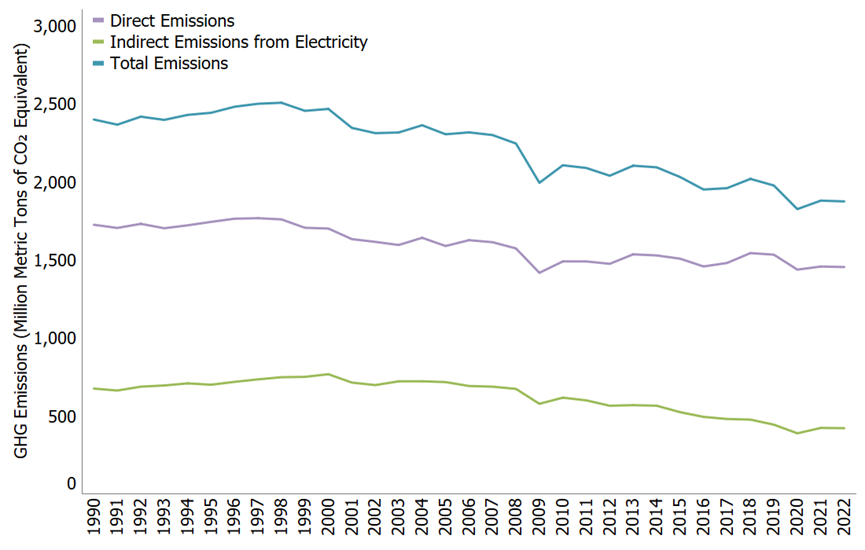
- From 2021 to 2022, total energy use in the industrial sector decreased by less than 1%. Total U.S. greenhouse gas emissions from industry, including electricity, have declined by 22% since 1990.
Reducing Emissions from Industry
There are a wide variety of industrial activities that cause greenhouse gas emissions, and many opportunities to reduce them. The table shown below provides some examples of opportunities for industry to reduce emissions. For a more comprehensive list, see Chapter 11 of the Contribution of Working Group III to the Sixth Assessment Report of the Intergovernmental Panel on Climate Change. 1
| Type | How Emissions Are Reduced | Examples |
|---|---|---|
| Energy Efficiency | Upgrading to more efficient industrial technology. EPA's ENERGY STAR® program helps industries become more energy-efficient. | Identifying ways that manufacturers can use less energy for powering buildings, industrial processes and to run equipment. |
| Fuel Switching | Switching to fuels that result in less CO2 emissions but the same amount of energy, when combusted. | Using natural gas instead of coal as process input. |
| Recycling | Producing industrial products from materials that are recycled or renewable, rather than producing new products from raw materials. | Using scrap steel and scrap aluminum as opposed to smelting new aluminum or forging new steel. |
| Training and Awareness | Making companies and workers aware of the steps to reduce or prevent emissions leaks from equipment. EPA has a variety of resources for training and other steps for reducing emissions. EPA has experience working with the aluminum, semiconductor, and magnesium industries. | Instituting handling policies and procedures for perfluorocarbons (PFCs), hydrofluorocarbons (HFCs), and sulfur hexafluoride (SF6) that reduce occurrences of accidental releases and leaks from containers and equipment. |
References
- IPCC, 2022: Climate Change 2022: Mitigation of Climate Change. Contribution of Working Group III to the Sixth Assessment Report of the Intergovernmental Panel on Climate Change [P.R. Shukla, J. Skea, R. Slade, A. Al Khourdajie, R. van Diemen, D. McCollum, M. Pathak, S. Some, P. Vyas, R. Fradera, M. Belkacemi, A. Hasija, G. Lisboa, S. Luz, J. Malley, (eds.)]. Cambridge University Press, Cambridge, UK and New York, NY, USA. doi: 10.1017/9781009157926