Section 9: Ground Water - Likelihood of Release
As discussed in the previous section, aquifers are one of the central evaluation units in the HRS. Section 8 discussed the HRS definition of an aquifer and how to delineate its boundaries. This section describes how to evaluate the likelihood of release factor category for an identified aquifer for the purpose of scoring the ground water pathway.
9.1 Definitions
Pages 116-177 of the HRS Guidance Manual (Section 7.1) provide the definitions to some key terms. Of particular importance are:
- Aquifer: Notice that the phrase "currently used or could be used" implies that the aquifer does not necessarily have to be used as a source of water to be evaluated. This definition differs from many common definitions because it is use-based.
- Aquifer boundary: Aquifer boundaries often depend on interconnections and relative hydraulic conductivity between geologic materials. These dependencies are themselves important definitions.
- Aquifer discontinuity: Geologic and hydrologic features or structures that entirely transect an aquifer (or multiple aquifers, if interconnected) and that are expected to disrupt and/or prevent the flow of ground water and hazardous substances across the feature or structure. Aquifer discontinuities are a type of aquifer boundary.
- Aquifer interconnection: Subsurface conditions that allow two or more aquifers separated by aquifer boundaries to be combined into a single aquifer; subsurface conditions must demonstrate that the aquifer boundaries separating the aquifers do not or would not impede the flow of ground water and hazardous substances between the aquifers. Aquifer interconnections are evaluated within two miles of the site and in areas underlying contamination attributable to the site.
- Hydraulic conductivity (K): The overall ability of water to flow through a geologic material, accounting for all openings in the material (e.g., between grains, through fractures, along lava tubes). For HRS purposes, the terms hydraulic conductivity and permeability are used interchangeably.
- Confining layer: Defined by a 100 times or more difference in K between layers.
- Layer of lower hydraulic conductivity: Defined by at least 100 times difference in K between layers. Note that Section 7.1 of the HRSGM defines a layer of lower hydraulic conductivity as equal to or greater than 100 times difference in some places, and greater than 100 times in others. The correct definition is equal to or greater than 100 times difference in K.
- Single hydrologic unit: The combination of geologic materials and aquifers that are determined to be within the same aquifer boundaries, including all interconnected aquifers.
- Target Distance Limit (TDL): The target distance limit is the distance over which targets are evaluated. For the ground water pathway, the target distance limit is generally a four-mile radius from the sources at the site, except: Any drinking water well with an observed release attributed to the site is evaluated, regardless of its distance from the source.
9.2 Calculating Likelihood of Release

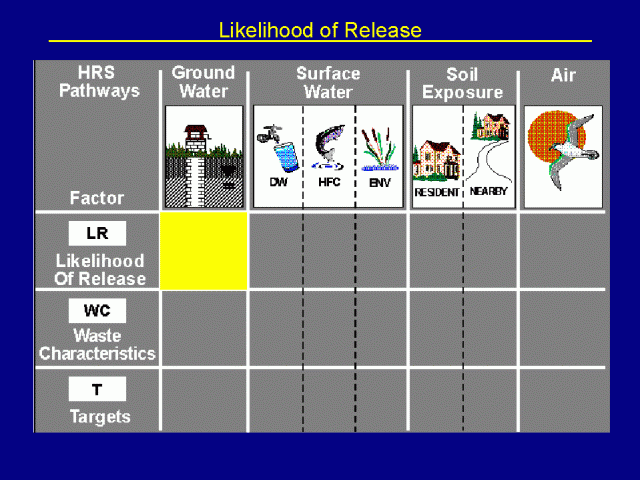
This graphic shows where likelihood of release for the ground water pathway fits into the overall HRS structure.
Paralleling the other two migration pathways, the ground water pathway likelihood of release factor category reflects the likelihood that there has been, or will be, a release of hazardous substances in any of the aquifers underlying the site. If an observed release can be demonstrated to an aquifer, the LR factor category is assigned a value of 550. Otherwise, the potential to release factor are evaluated for the aquifer and the LR factor category assigned that value (up to a maximum of 500).
It is important to remember that interconnected aquifers are treated as a single hydrologic unit. Thus, if three interconnected aquifers are stacked one above the other, the potential to release is evaluated based on the characteristics of the uppermost aquifer. Since two of the four potential to release factors incorporate depth as a consideration, the interconnection of the aquifers may significantly increase the potential to release values for deeper aquifers.
An observed release can result from either direct observation of the deposition of hazardous substances into an aquifer or chemical analysis of ground water samples from an aquifer. Ground water sampling is distinct from other types of sampling (e.g., surface water or air) in that there is a high cost of installing monitoring wells and there is uncertainty about flow direction and, hence, uncertainty in both background and attribution.
The two most common cases of observed releases to ground water by direct observation are:
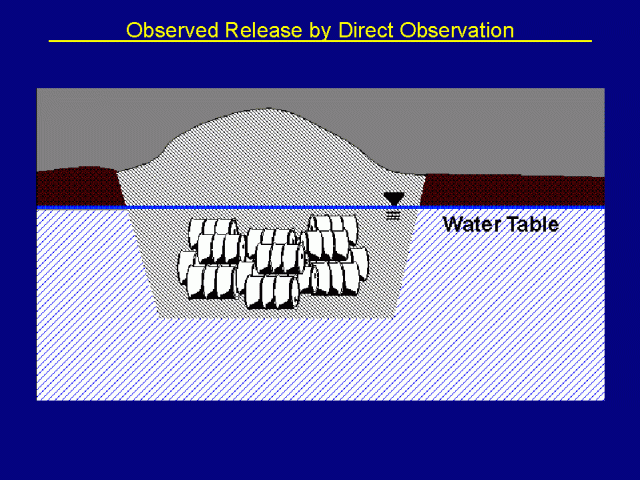
- Burial of material below water table (including evidence that there are hazardous substances present in the material and the water table has risen); and
- Injection wells to deeper aquifers (including evidence that hazardous substances are injected).
The following diagram illustrates the former scenario.

In this scenario, a pit has been excavated to a depth below the normal water table. This may have taken place during a drought, for example, or prior to a change in the water table. Drums known to contain hazardous substances were then placed into the pit and the pit was filled-in with soil. Because at least some of the drums placed in the pit are now below the water table, the requirements for an observed release by direct observation have been met. Evidence indicating that the drums are leaking is not required.
An observed release by chemical analysis is documented when analysis of ground water samples from the aquifer indicates that the concentration of hazardous substance(s) has increased significantly above the background concentration. Some portion of the significant increase must be attributable to the site to establish the observed release.
A few things to keep in mind when trying to document an observed release through chemical analysis:
- Be sure to take all ground water samples from aquifers, not from the saturated material above an aquifer, which is a common mistake made at site inspections.
- At the focused site inspection, obtain ground water samples from any available wells, especially residential wells that may be subject to actual contamination.
Often the screening intervals of residential wells are not known, making comparisons to background difficult. Nevertheless, always be sure that the background and release wells are in similar locations within the same aquifer. Highlights 5-5, 5-6, 5-7 of the HRS Guidance Manual illustrate the importance of well screening intervals when comparing background and release wells, particularly when evaluating LNAPLS (floaters) and DNAPLS (sinkers).
9.3 Potential to Release
Potential to release is evaluated only when an observed release cannot be scored. Each aquifer is evaluated independently.
Potential to release or PR, is evaluated using the following four factors:
- Containment: A value is assigned for each source and the highest value (least contained) is chosen. Containment is a critical factor in calculating potential to release. For example, if a source does not experience a loss of containment (i.e., the containment value is zero), no migration of hazardous substances will occur. Appropriately, if the containment value is zero (fully contained against release), then the potential to release value is zero, regardless of the values of the other factors (recall the equation PR = containment x [net precipitation + depth to aquifer + travel time]). (Normally, however, containment is usually 9 or 10 at CERCLA sites.) An increase in the containment value of only one unit has the effect of increasing the PR value by the sum of the net precipitation, depth to aquifer, and travel time values.
- Net precipitation is determined from a map found in Figure 3-2 of the HRS Rule. In nature, net precipitation is the driving migration force for most substances, so wetter areas (e.g., the Pacific Northwest) will receive a higher value.
- Depth to aquifer is measured for each aquifer scored. It ca receive a maximum of five points.
- Travel time is estimated using the thickness and conductivity of the geological materials. Because travel time receives up to 35 points, it is also a critical factor in the PR value.
Containment
For each source affecting an aquifer, evaluate its containment value using Table 3-2 of the HRS Rule. Table 3-2 allows a score to be assigned to each source. Of all sources scored, the highest value is entered in Table 3-1, line 2a. However, do not include any source that would receive a source hazardous waste quantity value of less than 0.5 in determining the overall containment factor value. The containment minimum size requirement provision prevents a small spill area from swinging the score of a large, generally well-managed site.
Highlight 7-23 of Section 7.3 of the HRS Guidance Manual shows the sizes of various sources that satisfy the minimum size requirement.
Net Precipitation
In the absence of physical migration barriers, net precipitation is the driving force for migration to the aquifer. Figure 3-2 of the HRS Rule provides computed net precipitation factor values, based on site location. Notice that values are highest in the wettest areas (e.g., the Pacific Northwest).
For sites that cannot be assigned a value from Figure 3-2, a method for calculating net precipitation is provided in the HRS Rule, beginning on page 51600. From the equation provided, plug the product into Tables 3-3 and 3-4 are used to arrive at the factor value that is used in Table 3-1, line 2b.
Net precipitation value published in independent sources should not be used in HRS evaluations. The HRS definition of net precipitation addresses months in which evapotranspiration exceeds precipitation differently from the methods used in agricultural data (for example). Months with negative net precipitation do not affect the HRS net precipitation value so as to reflect the absence of upward substance migration during these months.
Depth to Aquifer
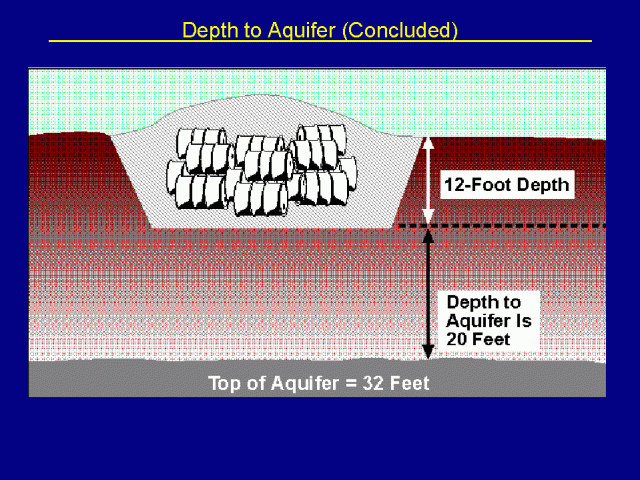
The depth to aquifer value measures the depth from the lowest known point of hazardous substances at a site to the top of the aquifer being evaluated. To calculate depth to aquifer, the depth from the surface to the lowest known point of hazardous substances at the site is subtracted from the depth from the surface to the top of the aquifer. Once the actual depth is calculated, the depth to aquifer factor value is obtained from Table 3-5 of the HRS Rule. This is the value then used in line 2c of Table 3-1, which calculates the score for the aquifer.
Additional information used in scoring the depth to aquifer factor value:
- The depth measurements must be made within two miles of the sources at the site unless an observed release extends beyond two miles. Even with this range, however, a measurement should only be taken from the lowest point of hazardous substance disposition at the site.
- Because of the unique characteristics of karst terrain, intervening karst aquifers are assigned an effective thickness of zero in determining depth to an underlying aquifer. Thus, in calculating the depth to an aquifer lying below a karst aquifer, the true thickness of the karst aquifer should be deducted from the depth calculated as above, to determine the depth to the aquifer for HRS purposes.
- The measurement of depth to aquifer should be in terms of elevation above sea level rather than in terms of depth from surface to avoid errors.
Below is an example of how to calculate depth to aquifer.

Travel time
Travel time reflects the time it takes for substances to travel from the source through intervening layers to an aquifer. It is based on the thickness and the hydrologic conductivity of the least permeable layers between the lowest known location of hazardous substances and the top of the aquifer. Layers that are thick and/or have low hydrologic conductivities increase travel times.
- The characteristics of the lowest conductivity layer(s) determine the travel time factor value: If more than one layer has the same lowest hydraulic conductivity, include all such layers and sum their thicknesses.
- Hydraulic conductivities may be determined using HRS Table 3-5 based on the physical characteristics of the layers or from actual, representative, measured, hydraulic conductivity values. Actual values are preferred.
- In the absence of an observed release to another aquifer, measurements of the layers must be made within two miles of the sources at the site and must lie in the interval between the lowest known point of hazardous substances at the site and the top of the aquifer being evaluated.
- Consider only those layers at least 3 feet thick which do not lie within the first 10 feet of the depth to the aquifer.
- For any given layer, determinations of thickness and hydraulic conductivity must be made at the same location. However, the locations used for the layers may differ from each other.
- If information is available for several locations, evaluate the travel time factor at each location and use the location having the highest travel time factor value.
In evaluating the travel time factor, layers are grouped according to common hydraulic conductivity. The thicknesses of the layers lying in the lowest conductivity grouping are summed. This thickness and the hydraulic conductivity of the lowest conductivity group determine the travel time factor as provided in HRS Rule Table 3-7. The resulting value is entered in Table 3-1, line 24.
The maximum travel time factor value of 35 is assigned if either:
- the depth to aquifer is 10 feet or less; or
- all intervening layers under a source are karst (karst layers have unique features that can dramatically facilitate movement of substances).
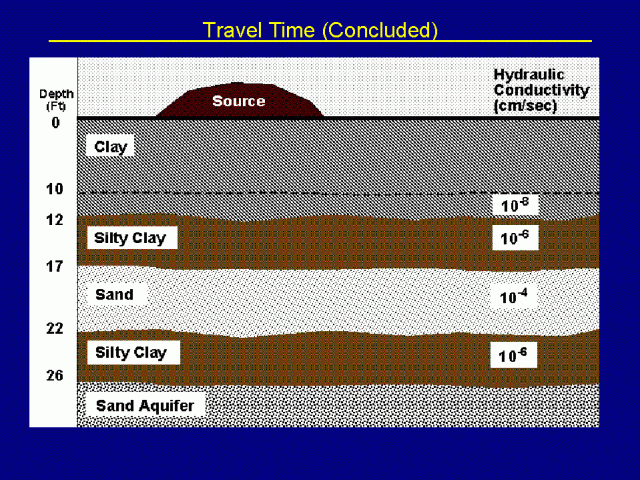
Below is an illustrated example of scoring travel time.

9.4 Questions and Answers
What is the depth to aquifer at this site?
Depth from surface to top of aquifer = 32 feet. Depth from surface to lowest point of hazardous substance = 12 feet. Depth to aquifer = 32-12 = 20 feet.
Suppose there is a bore hole with a hit in the plug at 25 to 28 feet below ground surface. What is the depth to aquifer now?
Depth from surface to top of aquifer = 32 feet. Depth from surface to lowest point of hazardous substance = 25 feet. Depth to aquifer = 32-25 = 7 feet.
Now compare these two results using Table 3-5 of the HRS Rule. How would the factor value have changed between the depth to aquifer values of 20 feet and 7 feet?
In fact, it would not have changed at all, which illustrates that unless the measurement is near a breakpoint, it does not need to be very precise.
What is wrong with the example provided?
Depth was measured in terms of below ground surface instead of above mean sea level. This can create errors when the terrain is not flat.
What would be the travel time factor value for this site?
After ignoring the top 10 feet and the remaining two feet of the top layer (without the the layer's top 10 feet, only 2 feet would remain), the lowest hydrologic conductivity value is found to be that of silty clay (10E-6). Since there are two layers of silty clay, their thicknesses are added to derive a total thickness of 9 feet. The hydrologic conductivity value and the combined thickness are then applied to Table 3-7 to derive a travel time factor value of 15.
Name five references or sources of information you might use to get documentation for ground water likelihood of release values.
Geologic report of site and/or vicinity (with geologic cross-section).
- Ground water use report (to establish whether ground water is an aquifer).
- Site reports from nearby facilities.
- Well logs.
- Analytical results of ground water samples from wells (including flow direction).
- Design/construction specifications for sources.
- Field observations/photos of source characteristics.
Give at least three criteria that should be considered to show that a sample from an observed release well is "similar" to a sample from a background well.
Well depths and screen intervals.
- Dates/times samples were collected (must be within reasonable period).
- Well design/construction information.
- Well sampling procedures.
- Analytical procedures and handling of samples.
- Environmental setting.
Can an observed release to an aquifer by chemical analysis be used to document a source containment value of 10 based on "evidence of hazardous substance migration"?
Only if the observed release is directly attributable (at least in part) to the specific source for which containment is being evaluated. Since containment is source-specific, it must be proved that the "evidence of hazardous substance migration" is from that source and not from another.
Continue to Section 10: Ground Water - Waste Characteristics & Targets
Navigate to another section of the course:
Section 1: Regulatory Context of the Hazard Ranking System
Section 2: Site Assessment Process
Section 4: Source Characterization
Section 5: Waste Characteristics
Section 6: Likelihood of Release
Section 8: Groundwater - Aquifers
Section 9: Groundwater - Likelihood of Release
Section 10: Groundwater - Waste Characteristics & Targets
Section 11: Surface Water - Likelihood of Release
Section 12: Surface Water - Drinking Water Threat
Section 13: Surface Water - Human Food Chain Threat
Section 14: Surface Water - Environmental Threat
Section 15: Surface Water - Ground Water to Surface Water Component
Section 16: Air - Likelihood of Release
Section 17: Air - Waste Characteristics & Targets
Section 18: Soil Exposure - Resident Population Threat
