
Assessment Endpoints
"Assessment endpoints are explicit expressions of the actual environmental value that is to be protected, operationally defined by an ecological entity and its attributes" - Guidelines for Ecological Risk Assessment
Assessment endpoints are environmental characteristics of a water body that represent the desired environmental condition described by the management goals. They also are valued ecosystem characteristics that are worth protecting. An assessment endpoint can be a measurable indicator of a biological community (e.g., seagrass, benthic communities) or a physical or chemical characteristic within the water body (e.g., turbidity, dissolved oxygen [DO]). Because assessment endpoints can be measured, they provide a useful indicator that can link nutrient pollution to management goals (e.g., what nutrient concentration would allow the designated use such as fisheries or recreation to be maintained?).
| Endpoint | Examples of Measures |
|---|---|
| Seagrass | Acreage, density, species composition, historic depth of colonization |
| Phytoplankton | Chlorophyll a concentrations, species composition, microscopic counting, biovolume estimation (e.g., ash-free dry weight) |
| DO | Direct measure of dissolved oxygen (e.g., using DO meters) |
| Clarity | Secchi depth, turbidity, light attenuation (e.g., photosynthetically active radiation) |
Water quality managers can use this linkage between nutrient concentrations and the assessment endpoints to identify concentrations of nutrients that would support designated uses.
Characteristics
Assessment endpoints should have the following characteristics:
- Relevance to protecting and maintaining the ecological conditions of a water body or class of waters
- “Ecologically relevant endpoints often help sustain the natural structure, function, and biodiversity of an ecosystem or its components.”
- Sensitivity to nutrient inputs
- What is the effect on the endpoint of change in nutrients?
- How quickly does the endpoint respond to nutrient changes?
- Relevance to protecting management goals for a water body or class of waters
- Does the endpoint reflect ecological values that are important to the public?
- Can the endpoint be used to address the water body’s regulatory requirements?
- Measurable
- Can the ecological entity/characteristic and its attribute be measured directly or indirectly?
- Availability of data
- Are there sufficient data available to conduct analyses (i.e., sufficient in both quantity and quality)?
Examples
Examples of assessment endpoints include the following:
- Phytoplankton biomass
- Seagrass health
- DO
- Benthic communities
- Water clarity
After deciding whether an ecosystem entity/characteristic is appropriate to use as an assessment endpoint for nutrient criteria development and how to measure it, water quality managers can use the information obtained to identify a numeric target value that represents attainment of the designated use.
Identifying Potential Assessment Endpoints
When you are trying to identify potential assessment endpoints, a good first step is to look at the management goals for a water body with respect to nutrients and develop a general list of biological, physical, and chemical factors representative of the desired ecological condition. The choices of assessment endpoint will be narrowed down based on the type of water body and existing regulatory management goals. For instance, if protection of aquatic life is a management goal, an assessment endpoint might include some measure of the biological community in the water body or a desired concentration of DO that would be needed to protect that goal.
To determine which ecological entity or characteristics could make effective and useful assessment endpoints for the nutrient criteria you wish to derive, ask the following questions:
How relevant is this potential endpoint to the management goal and designated use?
- Are there any statutory requirements stipulating what is to be protected (e.g., specified DO criteria; acres of seagrass)?
- Does the endpoint represent an ecological outcome, condition, process, or activity that scientists, the public, and water quality managers want to protect? Examples include:
- Endangered species or ecosystems
- Commercially, recreationally, or culturally important species
- Aesthetic values such as swimmable beaches
Is the potential endpoint ecologically relevant?
- Is the potential endpoint an important part of its ecosystem? Is it functionally related to other features in the ecosystem? If so, to what degree?
- What are the effects of nutrients on the potential endpoint and to what degree are they expressed (e.g., when an increase in nutrients causes a dramatic negative change in the attribute of value)?
- What are the spatial and temporal scales of the effects of nutrients?
- What is the potential for recovery from nutrient impacts?
- What level of ecological organization is adversely affected by nutrient pollution?
Is the potential endpoint sensitive to nutrient pollution?
- Is there a demonstrable relationship between nutrients and the potential endpoint? If so, what is that relationship?
- Is the potential endpoint directly affected by nutrients or by nutrient-related impacts?
- Often, impacts further down the effects pathway can take longer to manifest and also be influenced by other confounding stressors.
- Are there other stressors or natural disturbances that might confound, lessen, or exacerbate the effect of nutrients on the potential endpoint?
What is the level of exposure of the potential endpoint to nutrients?
- What are the typical magnitudes, durations, and frequencies of exposure to nutrients?
- What concentration of nutrients supports the endpoint?
- At what concentration of nutrients would one expect to see adverse impacts?
What is the fate and transport history of the potential endpoint and nutrients in the system?
- How and where do nutrients enter and move through the water body? What is the residence time?
- Does the potential endpoint express nutrient effects at the same time it was exposed or a different time? In the same place it was exposed or a different place?
- Nutrients are usually not conservative, which leads to different concentrations in different parts of a water body. As a result, responses to nutrients can be site-specific depending upon the amounts transported.
- For a biological endpoint, nutrient sensitivity can be influenced by individual or community life history characteristics
- Species with short life cycles and high reproductive rates can express the effects of nutrients quickly.
- Is there a life stage of the potential endpoint that is particularly sensitive to nutrients? Often early stages of aquatic life are more sensitive than later stages, but different life stages can be affected (e.g., larval, nesting, migrating, breeding, molting).
Indications that your endpoint is sensitive
- Change in primary productivity as nutrients increase
- Increase in respiration rate with nutrient pollution
- Changes in primary producer community structure due to increases in nutrients (changes in abundance and richness)
- Changes in aerial coverage
- Changes in concentration
Ways to measure assessment endpoint sensitivity
- Chlorophyll a (primary productivity)
- DO (respiration rate)
- Species percent (changes in plant community structure)
What factors affect sensitivity
- Fate/transport and retention of nutrients
- Presence of other stressors or natural disturbances
- Residence time
- Response time lags
Selecting an Assessment Endpoint Representative of the Management Goal
There are two elements that you should identify when you are defining an assessment endpoint:
- The specific attribute or entity representative of the ecological condition the criteria aim to protect
- The characteristic of that attribute or entity that responds to nutrients and is important to protect
For a biological endpoint, an attribute or entity could be an individual species, a community, a functional group (e.g., primary producers), an ecosystem, or a particular habitat (e.g., seagrass). For a chemical or physical endpoint, the attribute could be a specific concentration or level that is measureable. Sometimes, you already have identified an attribute when you were selecting potential endpoints; but at other times, an ecosystem characteristic might need a little more specificity. For example, on one hand, you might have already identified seagrass as being important. But, on the other hand, your goal might be to protect aquatic system health, in which case, you need to define what entities are representative of good system health.
Next, consider characteristic of the assessment endpoint responds to nutrient inputs and should be protected or maintained. It could be the count, density, concentration, coverage, biomass, community composition, survival, growth, or some other aspect that is impacted by nutrients and is important to protect.
Some guidelines to keep in mind when selecting assessment endpoints:
- Unlike management goals, assessment endpoints are neutral and do not express any statement as to their desired state.
- As with management goals, your assessment endpoint must be as clear and as specific as possible. For example, concepts like health, integrity, and unimpacted are vague and should be clearly defined. Selecting organisms or concentrations that are considered representative of these terms can be helpful.
Selecting Assessment Endpoints for Numeric Nutrient Criteria Derivation—Data Needs
To ensure that an assessment endpoint is suitable for numeric nutrient criteria (NNC) derivation, the relationship of the selected entity or attribute to nutrients should be well-documented in the available literature. Additional factors to consider when selecting an attribute or entity as an assessment endpoint include:
- Data availability—Because data are key to criteria derivation analyses, it is important to consider the data requirements for describing the endpoints and make statistical inferences about the relationships between the assessment endpoint and nutrient levels of impairment.
- What are the available data types, locations, temporal and spatial coverages, quality, and quantity?
- What are the data needs for the potential types of analysis? For example, stressor-response relationships can be data-intensive and will require enough data for the type and number of parameters being investigated.
- Data limitations and uncertainty should be acknowledged.
- Spatial and temporal representativeness—The available data should provide information about the ecological expectations for the selected endpoint within the water body of concern over time, including the presence and absence of an endpoint within the water body, in a specific location, during a certain season, and throughout the year.
- Do the data represent the times and places pertinent to criteria development?
- Do the data show when and where the response to nutrients occurs?
Quantifying the Level of Protection after Criteria are Established
Assessment endpoints not only are used to qualitatively connect the management goal to the water quality-related attributes requiring protection. They also are used to establish the numeric threshold for nutrient enrichment within the water body of concern. Setting the numeric threshold is done in two steps. First, identify a measurable effect of nutrients on the assessment endpoint. This measure of effect often is established when defining the assessment endpoint. For example, you might have selected seagrass aerial coverage as the assessment endpoint. In that case, the measure of effect is the aerial coverage of seagrass. In other instances, you might need to be more specific in describing exactly what about the assessment endpoint you want to measure. For example, your assessment endpoint might be macroinvertebrate community composition. In this case, you need to define exactly what you want to measure as the metrics of community composition (e.g., an Ephemeroptera, Plecoptera and Trichoptera (EPT) richness, percent model affinity, richness, or functional feeding groups). Another example could be setting your assessment endpoint as DO to maintain healthy aquatic life in a water body. In that case, you need to know what concentration of DO would be necessary to keep specific species of fish or benthic communities alive.
The next step in the process is to set numeric targets, or water quality targets, for the measures of effect. The water quality targets are used in developing nutrient criteria to quantitatively define the level of nutrients that represents the ecological condition expressed by the management goal. The quantitative target can be used to statistically determine whether the water body is supporting the valued components of the ecosystem, and thus the management goals. In this case, it would be the basis for deriving nutrient criteria values.
To determine a protective water quality target value, consider what level of the assessment endpoint is representative of the management goal for the system. You can accomplish this by reviewing pertinent contemporary and historical literature. Research done of the system of interest can provide direct insight into the behavior of the local ecosystem. That data might not be available, however, in which case literature collected in similar systems can be informative. In addition to literature, input from experts familiar with the system or similar systems can help guide your decision. You then can synthesize the sources to decide on what level of the endpoint indicates support of the management goals for the system. A helpful tool that has been used successfully in a variety of settings is a decision-making framework, which you can use to guide the process. Regardless of the method you use, it is important to document all of the choices you made and resources you used to set the water quality target.
Note: In instances in which measureable data are not available to support the selection of an endpoint, you cannot use that endpoint for numeric criteria derivation. Additionally, each endpoint you select to represent the management goal should have a numeric water quality target supported by the literature-available information. If data do not support a water quality target related to nutrients, the endpoint cannot be used to support numeric criteria derivation.
Using the available data, we have compiled a list of potential assessment endpoints for each water body type that meet the criteria described in this section. Each example includes an assessment endpoint, a description of the valued attribute or entity, the measure of effect, and the water quality targets that can be used in statistical analysis. The endpoints presented are viable options to consider when initiating the process of the NNC derivation. You are not limited to the examples provided.
Phytoplankton
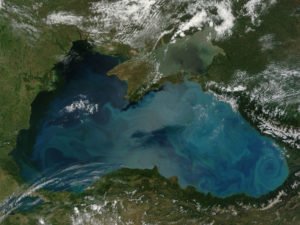
Description: Phytoplankton are free floating, photosynthetic microscopic organisms. It is important to remember that some phytoplankton species are adapted to freshwater environments, while others live in more saline waters.
- Relevancy to management goals: As a key food source, phytoplankton are vital to supporting aquatic life. However, unbalanced phytoplankton populations can be detrimental to aquatic life and human health uses.
- Ability to measure: Phytoplankton can be measured by microscopic counting, electronic particle counting, and determination of chlorophyll a concentration.
- Ecological relevance: Long-term elevated concentrations of phytoplankton can adversely affect habitat quality and aquatic life. They shade light from submerged aquatic vegetation (SAV) and decrease dissolved oxygen (DO) through their respiration and decomposition.
- Data needs: Biomass data are routinely monitored, and data are generally abundant for most water bodies. Satellite-derived data often are readily available for estuarine and coastal waters.
- Sensitivity to nutrients: Phytoplankton have fast growth rates and respond rapidly to increases in nutrients. Nutrient pollution can cause increases in the maximum and mean concentrations of phytoplankton.
- Public importance: Unusually high concentrations of phytoplankton, known as blooms, can adversely affect aesthetics, recreation, and aquatic life habitat. Harmful algal blooms also can affect human and aquatic health by producing a variety of toxins.
Macroalgae

Description: Macroalgae, also referred to as “seaweed,” are macroscopic and multicellular algae that generally grow on relatively shallow, rocky substrata. They typically belong to one of several groups of multicellular algae, including red algae, green algae, and brown algae. Unlike seagrass, macroalgae have no roots, stems, leaves, or vascular tissues.
- Relevancy to management goals: Macroalgae are important primary producers in some coastal regions and provide a food source for the higher trophic organisms.
- Ability to measure: Species richness and species diversity, the two most basic attributes measured for macroalgae, are sampled through aerial photography, remote sensing, and field survey. Aerial density can also be used to quantify macroalgal populations.
- Ecological relevance: Macroalgae serve as a nutrient filter in ecosystems. Blooms develop, however, when sufficient nutrients are present, resulting in low levels of dissolved oxygen, high turbidity, and disruption of phytoplankton, submerged aquatic vegetation, coral reefs, and higher trophic levels.
- Data needs: Data are needed from field surveys or aerial photographs.
- Sensitivity to nutrients: While macroalgae do not respond as rapidly to environmental changes as phytoplankton, they have been widely noted as an important response to nutrient pollution.
- Public importance: Macroalgae have a variety of usages, including as food sources and chemical ingredients.
Harmful Algal Blooms (HABs)
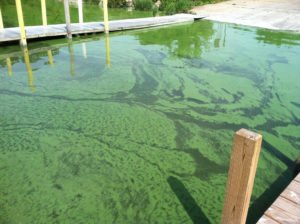
Description: Harmful algal blooms (HABs) are excessive growths and accumulations of algae that create health hazards for humans or animals through the production of toxins and/or as a result of their high biomass levels. They also can degrade aesthetic, ecological, or recreational values.
- Relevancy to management goals: Phytoplankton are critical for maintaining the health and balance of aquatic life; however, HABs negatively impact other organisms by reducing water clarity a nd creating hypoxic conditions. They also impair drinking water and recreational uses through the production of toxins and excessive biomass levels.
- Ability to measure: The intensity of HABs can be characterized or measured in a variety of ways, including Secchi disk depth, chlorophyll a concentration, cell identification and count, analysis of microcystin and other cyanotoxin concentration, and satellite imagery.
- Ecological relevance: Algae play a critical role in aquatic ecosystems as primary producers and the base of the food chain; however, when excessive levels of nutrients trigger bloom conditions—especially of the cyanobacteria algal group—the overgrowth disrupts the food web, reduces light penetration into the water column, and often creates low-oxygen conditions that harm other species.
- Data needs: Site-specific, long term empirical data of cyanotoxins, chlorophyll a, and other measures of algal bloom characteristic are needed.
- Sensitivity to nutrients: HABs are generally associated with increases of nutrient loading and overenrichment of aquatic ecosystems.
- Public importance: The primary concern with HABs is their potential toxicity to animals and people as well as their increased biomass, which impairs drinking water, recreation, fishing, and other beneficial uses.
Diatom Assemblages
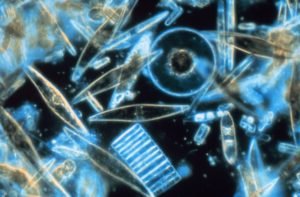
Description: Diatoms are a major group of algae that include species ranging from very sensitive—or intolerant—to very tolerant of disturbances to their natural habitat.
- Relevancy to management goals: A natural balanced diatom community helps support aquatic life in the ecosystem by functioning as a primary producer and as a food source for higher organisms.
- Ability to measure: Stream diatom assemblages are characterized by identifying and enumerating diatom species in the community and classifying them based on taxa sensitivity.
- Ecological relevance: Healthy and diverse diatom communities are an important part of the food web, serving as primary producers and as food for zooplankton, macroinvertebrates, and other higher organisms.
- Data needs: Site-specific collections of diatom species within defined resource community boundaries.
- Sensitivity to nutrients: The assemblage of taxa within a diatom community is determined by nutrient levels and other factors that define biological integrity. Increases in nutrient levels trigger shifts in community structure toward more tolerant species.
- Public importance: Natural stream systems supporting healthy diatom assemblages also tend to support desirable native fisheries that increase recreational values and opportunities.
Water Clarity
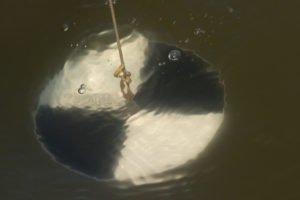
Description: Water clarity is a measure of how far light penetrates into the water column; the deeper light penetrates, the clearer the water.
- Relevancy to management goals: Many forms of aquatic life such as seagrasses depend on water clarity levels that allow light to penetrate the water column and reach the bottom.
- Ability to measure: Water clarity is most often measured in lentic (still) waters using a Secchi disk, while total suspended solids (TSS) and turbidity measurements are used to characterize water clarity in lotic (flowing) waters.
- Ecological relevance: Aquatic primary producers, including algae and submerged aquatic vegetation (SAV), require adequate amounts of light to photosynthesize and create energy and oxygen essential for fueling a healthy ecosystem.
- Data needs: Site-specific, long-term, Secchi disk depth data are needed for lentic waters, and suspended solids and turbidity data are needed for lotic waters.
- Sensitivity to nutrients: Increases in nutrient pollution can trigger increased growth of phytoplankton in the water column that reduce water clarity.
- Public importance: Good water clarity promotes healthy ecosystems and enhances recreational activities such as swimming and fishing.
Benthic Faunal Communities

Description: Benthic faunal communities are the collection of organisms that inhabit the bottom substrates of water bodies and include species that range from very sensitive (intolerant) to very tolerant of disturbances to their natural habitat.
- Relevancy to management goals: Benthic faunal communities are important for supporting aquatic life, especially as food sources for fish and other aquatic animals.
- Ability to measure: Benthic faunal communities are characterized by identifying and enumerating species and classifying them based on function and sensitivity (tolerance) to disturbances.
- Ecological relevance: Benthic organisms are an essential part of the food web, feeding on and breaking down organic matter as well as serving as food for fish and other organisms.
- Data needs: Site-specific collections of benthic faunal communities are needed from defined areas.
- Sensitivity to nutrients: The assemblage of taxa in the benthic faunal community is determined by nutrient levels as well as other factors that define biological integrity.
- Public importance: Stream systems supporting healthy benthic faunal communities also support native fisheries and provide recreational opportunities.
Epiphytes
Description: Epiphytes are naturally occurring primary producers that attach to surfaces of plants or other objects and often are called attached algae.
- Relevancy to management goals: Increase in epiphyte biomass, growth, and density could affect submerged aquatic vegetation (SAV) growth through light attenuation, thereby affecting aquatic life use.
- Ability to measure: Epiphytic biomass is typically quantified as chlorophyll a using various methods, including ash-free dry weight and biovolume of algae. Composition of the assemblage is quantified through direct sampling and taxonomic identification to species or lowest practical taxonomic resolution.
- Ecological relevance: Epiphytic algal assemblages provide energy to grazers and to the food web.
- Data needs: Species composition is difficult to measure, and epiphyte biomass and density are not usually monitored.
- Sensitivity to nutrients: Epiphytes are known to be highly sensitive to nutrient inputs. They can respond with an increase in biomass, growth rates, densities, and species composition.
- Public importance: Epiphytes can affect the health of SAV. SAV are valued by the public because of the role they play in sustaining valuable resources (e.g., fisheries, wildlife, and water clarity).
Coral

Description: Corals are marine invertebrates that include soft and hard corals. Coral reefs occur in clear, shallow waters throughout tropical regions. Reefs are formed from calcium carbonate skeletons, built by tiny coral animals that make up large coral colonies.
- Relevancy to management goals: The health of corals can affect commercial uses and recreational uses that include swimming, fishing, and boating.
- Ability to measure: There does not appear to be a standardized method to measure coral health or growth.
- Ecological relevance: Corals are highly productive systems and provide habitat and nursery areas for many aquatic species.
- Data needs: Corals are not regularly monitored and would need to be monitored.
- Sensitivity to nutrients: The response of corals to nutrient inputs can be direct or indirect. Corals require light to survive. An increase in nutrients can cause an increase in primary production. Increased turbidity resulting from the higher level of primary production could block the sunlight corals need.
- Public importance: Corals provide important aesthetic value. Reefs provide habitat for fish and other aquatic species.
Dissolved Oxygen
Description: Dissolved oxygen (DO) is a measure of how much oxygen is dissolved in water and potentially available to aquatic organisms for respiration.
- Relevancy to management goals: The health of aquatic and biological communities depends on sufficient DO in the water column; in other words, low DO and eutrophication directly affect designated uses such as aquatic life use and commercial and recreational fisheries.
- Ability to measure: DO has well-established and practical means of measurement, including using a DO meter and the iodometric method.
- Ecological relevance: Low DO (i.e., anoxia or hypoxia) impacts aquatic life, with effects ranging from mortality to chronic impairment of growth and reproduction.
- Data needs: DO data are routinely monitored, and data are generally abundant.
- Sensitivity to nutrients: A decrease in DO is a secondary symptom of an increase in nutrient inputs—increased respiration from an increase in primary producers and increased decomposition of organic material by microbial stimulation.
- Public importance: Low DO could trigger fish kills and mortality of benthic communities such as shellfish.
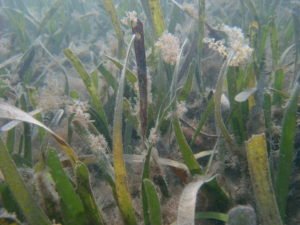
Submerged Aquatic Vegetation (SAV)
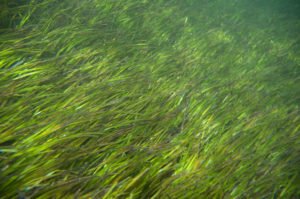
Description: Submerged aquatic vegetation (SAV) are rooted, underwater plants that occur widely in fresh and salt waters. In estuarine and coastal waters, SAV are often referred to as seagrasses.
- Relevancy to management goals: SAV provides food and shelter for fish and wildlife, thereby supporting aquatic life uses.
- Ability to measure: SAV is measured by coverage, density, species composition, and historic depth of colonization.
- Ecological relevance: SAV trap and stabilize sediments, help reduce nutrients in the water column, and provide important shelter, habitat, feeding, and spawning areas for many juvenile and adult aquatic species.
- Data needs: Site-specific long term empirical data on coverage, density, species composition, and historic depth of colonization and associated water quality (especially water clarity) is needed.
- Sensitivity to nutrients: Nutrient pollution negatively impacts SAV by causing increased growth of macroalgae and phytoplankton, which in turn decreases the amount of light available for photosynthesis.
- Public importance: SAV are valued by the public because of the role that they play in sustaining valuable resources (e.g., fisheries, wildlife, water clarity).