
Conceptual Models
A conceptual model is a written description and visual representation of relationships between stressors and resulting ecological conditions. Conceptual models are used to support the derivation of numeric nutrient criteria (NNC) derivation by describing relationships between biological, physical, and chemical conditions of a water body. Table 1 defines key elements of a conceptual model.
| Specific Element of a Conceptual Model | Definition |
|---|---|
| Management Goal | Risk criteria or statement reflective of protecting a designated use (e.g., fish kill prevention) |
| Assessment Endpoint | Ecological entity and its attributes to be protected to support designated use (e.g., algal biomass) |
| Measure | Measurable attributes of an assessment endpoint (e.g., chlorophyll a) |
| Stressor | Nutrient parameter responsible for changes in the water body (e.g., nitrogen) |
| Source | Origin of the nutrient pollution (e.g., agriculture, stormwater) |
Within EPA’s risk assessment framework, conceptual models illustrate ecological connections that build the foundation for analysis and development of numeric criteria. For NNC development, they integrate available information describing relationships among management goals, assessment endpoints, measures, stressors, and sources to present hypotheses concerning ecological risk associated with nutrient pollution. Each risk hypothesis identifies a probable source of nutrient pollution and its impact on the assessment endpoint selected to represent the management goal. The qualitative summary of information compiled in the conceptual model can support the approach selected to derive the NNC.
A conceptual model offers many benefits to the user, including:
- providing a powerful learning and communication tool;
- highlighting what is known and unknown about the water body response to nutrient pollution;
- providing a framework for prediction;
- offering a template for generating more hypotheses;
- being easily modified as knowledge increases; and
- helping describe the analysis plan for future work.
Basic Components of a Conceptual Model
In accordance with the Ecological Risk Assessment Guidance, conceptual models consist of two components:
- A narrative that describes predicted relationships between the stressor and assessment endpoint response, along with the rationale for their selection
- A diagram that illustrates the relationships presented in the narrative
Complexity of the conceptual model depends on the complexity of the problem; the number of sources, stressors, assessment endpoints, nature of effects, and characteristics of the ecosystem all influence complexity. For single stressors and single endpoints, conceptual models may be simple. However, when conceptual models are being used to describe pathways and interactions among multiple and diverse stressors and assessment endpoints, more complex models are often needed.
How to Develop a Conceptual Model
Conceptual models help identify information about the effects of nutrient pollution in the water body and on the assessment endpoint(s) you intend to use as the surrogate for designated use support.
Step 1: Assess System-specific Information
The system-specific information to include in your conceptual model should respond to the following questions:
- What is your management goal?
- What assessment endpoints have you selected as surrogates for management goals? What measures can be used to evaluate the assessment endpoints?
- What stressors affect the assessment endpoints identified?
- What sources of nutrient pollution are known to impact the assessment endpoint within your water body?
If you cannot answer the questions, seek expert advice or conduct research and collect new or existing data about the system you plan to protect. If no data are available, you might need to conduct some monitoring and collect data for the system.
Step 2: Develop a Risk Hypothesis
A risk hypothesis, the first component of a conceptual model, is a qualitative statement intended to represent known relationships between the source of nutrient pollution and its effect on the assessment endpoint based on available information. This hypothesis proposes predictions about the assessment endpoint response to nutrient pollution based on theory, empirical data, modeling, and best professional judgment. Answers to the questions in step 1 will provide the information you need to develop the risk hypothesis. Using the data and literature considered for this process, the statements clarifies and articulates the relationships identified to represent the management goals, assessment endpoints, and stressors used to derive NNC.
Step 3: Develop a Conceptual Model Diagram
The diagram, the second component of the conceptual model, is a visual representation of the risk hypothesis showing linkages among the elements. The details included in the risk hypothesis justify the relationships illustrated in the conceptual diagram. Diagrams also can provide insights into how the analyses could be approached.
Step 3, Part a: Consider Existing Models
If possible, start with a generic example of the known effects of nutrient pollution specific to your water body type, and tailor the model to the issues you want to highlight. In most cases, a generic example already exists for the water body type you intend to manage. You can find generic examples of conceptual models can be found in the literature, including the following publicly available examples:
- National Estuarine Eutrophication Assessment, Effects of Nutrient Enrichment in the Nation’s Estuaries (Bricker et al. 1999)
- A Compilation of Cost Data Associated with the Impacts and Control of Nutrient Pollution (USEPA 2015)
- Using Stressor-response Relationships to Derive Numeric Nutrient Criteria (USEPA 2010c)
- Handbook for Developing Watershed Plans to Restore and Protect Our Waters (USEPA 2008a)
- Indicator Development for Estuaries (USEPA 2008b)
- A Conceptual Ecological Model of Florida Bay (Rudnick et al. 2005)
Step 3, Part b: Build a Conceptual Diagram
If a preexisting model is not available, develop a conceptual model diagram based on the information compiled to define the management goal and support the selection of the assessment endpoints. When building a conceptual model diagram, consider the following suggestions:
- Use distinct and consistent shapes to distinguish between sources, stressors, measures, assessment endpoints, and management goals.
- Use arrows to show connections between model elements.
- Determine the potential to quantitatively measure the relationships.
- Consider the confidence level surrounding a pathway of nutrient pollution.
- Add complexity to the model as the level of knowledge of the system increases.
Once you gather all relevant data about the water body, identify the linkages that most closely relate to your management goal and assessment endpoints. Based on available data, determine which pathways of nutrient pollution are best supported by the information and thus are most viable for management. Further, determine which pathways best reflect the management goal. Those pathways are the risk hypotheses to highlight in the conceptual diagram. The conceptual diagram expands on the risk hypothesis by illustrating the working knowledge of relationships between all of the elements. It also can be beneficial to include the blocking pathways, which are the paths that might interfere with linkages between nutrients and assessment endpoints.
Practice Building a Conceptual Model
Apply what you have learned about developing a conceptual model at a high level to a real-world scenario by following the sequence in this section. This section walks through the four key questions outlined in Step 1 to build the example conceptual model. To illustrate this process, decisions toward building an example risk hypothesis are paired with the corresponding step in developing the model diagram.
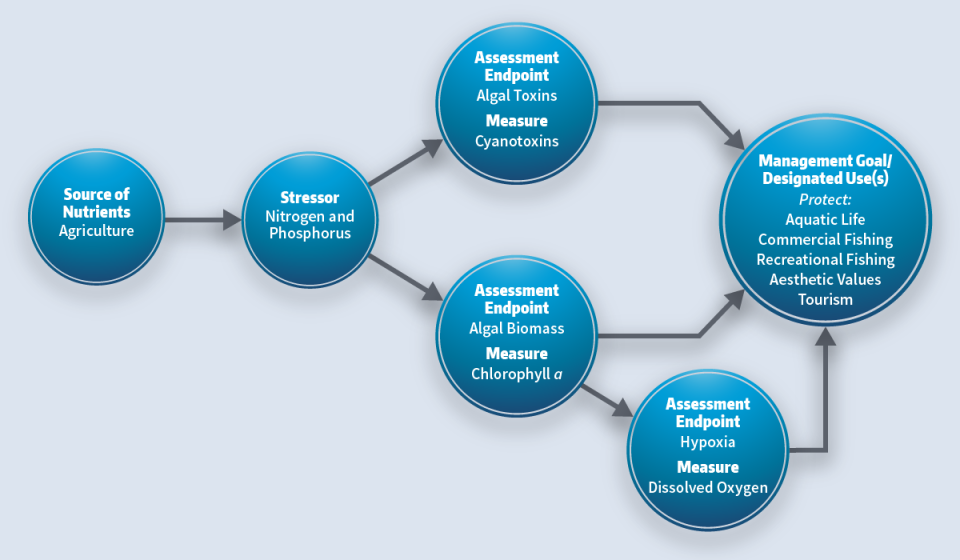
1. What is your management goal?
A water body is experiencing impacts to aquatic life, including loss of invertebrates and fish kills, commercial and recreational fishing, aesthetic values, and tourism. These designated uses are the management goals.
2. What assessment endpoints have you selected as a surrogate for management goals? What measures can be used to evaluate the assessment endpoints?
In the water body, algal toxins, algal biomass, and hypoxia are occurring. Those assessment endpoints can be measured, monitored, and evaluated with cyanotoxins, chlorophyll a, and dissolved oxygen.
3. What stressors affect the assessment endpoints identified?
Excess nitrogen and phosphorus in the water body are causing the changes in algal biomass and resultant decreases in oxygen, as well as increases in algal toxin producing taxa. The excess nutrient pollution is the stressor resulting in nonattainment of the management goal.
4. What sources of nutrient pollution are known to impact the assessment endpoint within your water body?
The watershed is surrounded by farms, which are a nonpoint source of nutrient pollution. Knowing the source of pollution provides a better understanding of the environmental changes needed to achieve the management goal. The source will be controlled after the criteria are set, during implementation of the criteria.