
Stressor-Response: Data Preparation
Step 2: Assemble Available Data
The availability of data often determines whether stressor-response analysis can be applied. After collecting all available data, these data should be assessed with respect to whether enough data are available and whether data provides sufficient temporal and spatial coverage.
Identify sources of data
State and national monitoring data sets often are the primary sources of data, but other entities also might have applicable data. A list of potential data sources is provided in the Data Library.
Is there enough data?
The more data you can obtain, the more flexibility you will have in analyzing the data. At a minimum, 10 independent samples are required for each degree of freedom estimated in the model. For a simple linear regression line defined by two coefficients, this rule of thumb suggests that a minimum of 20 samples is required. Each additional variable you consider further increases this minimum requirement, so if a single classification variable is considered in addition to the linear regression, the minimum number of samples increases to 30. The precision of different model parameter estimates also depends on the number of samples, so inferences from the stressor-response model are more accurate with more data.
Do the data provide adequate temporal and spatial coverage?
Consider whether the temporal and/or spatial coverage of the available data limits the applicability of the analysis results. For example, data collected only in the summer might indicate that criteria derived from those data are applicable only during the summer. The summer is commonly regarded as the critical period for the deleterious effects of elevated concentrations of nutrients to occur (e.g., primary production rates increase with warmer temperatures), however, so criteria based on summer data often are broadly protective.
Data matching
Matching data collected by different entities or at different frequencies by the same agency can often be challenging. For example, in a particular lake, weekly measurements of cyanotoxins might be available, but only a single concentration each for TN and TP are available from a different year. Deciding how to match these data requires you to understand the underlying processes by which elevated concentrations of nutrients are manifested as ecological effects and the management decisions that could be informed by the analysis. Possible questions to consider include the following:
- What are the timescales of the assessment endpoint and the management goal (e.g., the duration and frequency of the assessment endpoint)?
- Cyanobacteria blooms and associated elevated cyanotoxin concentrations can appear and disappear within days. How often should I allow exceedances of a cyanotoxin threshold while still assessing whether a water body is meeting its designated uses?
- What are the timescales of the nutrient concentrations? Nutrient concentrations in streams can vary substantially over short periods of time as flow changes, whereas nutrient concentrations in receiving lakes can be somewhat less variable in time.
- How quickly do I expect assessment endpoints to change in response to changes in nutrient concentrations? In lakes, conventional wisdom suggests that lakes respond to seasonally integrated loads of nutrients, whereas in streams, near-field effects of elevated concentrations of nutrients can occur in response to much briefer periods of elevated concentrations. Beneficial effects from reductions in phosphorus loads can occur relatively quickly in small streams, whereas in lakes, reductions in phosphorus loads might not yield immediate changes because loading from lake sediments may continue.
Data for different variables can be matched based on insights on different temporal and spatial scales. You might match summer mean nutrient concentrations in lakes with all cyanotoxin measurements collected during that summer because you expect that the variability of cyanotoxin concentrations during one summer is not related to the overall nutrient load. Rather, cyanobacteria are responding to other environmental factors such as temperature, growth dynamics, and water column stability.
Step 3: Explore Relationships across Data
Exploratory data analysis is a critical first step in understanding and visualizing relationships across different variables. It can provide you with initial insights into how different parameters vary in relation to each other. You can determine whether different variables are related and gain an initial understanding of the shape of those relationships. Data gaps and unanticipated relationships between variables also can be identified by exploring all of the available data. You can use graphical or numerical methods to explore the available data.
Graphical methods
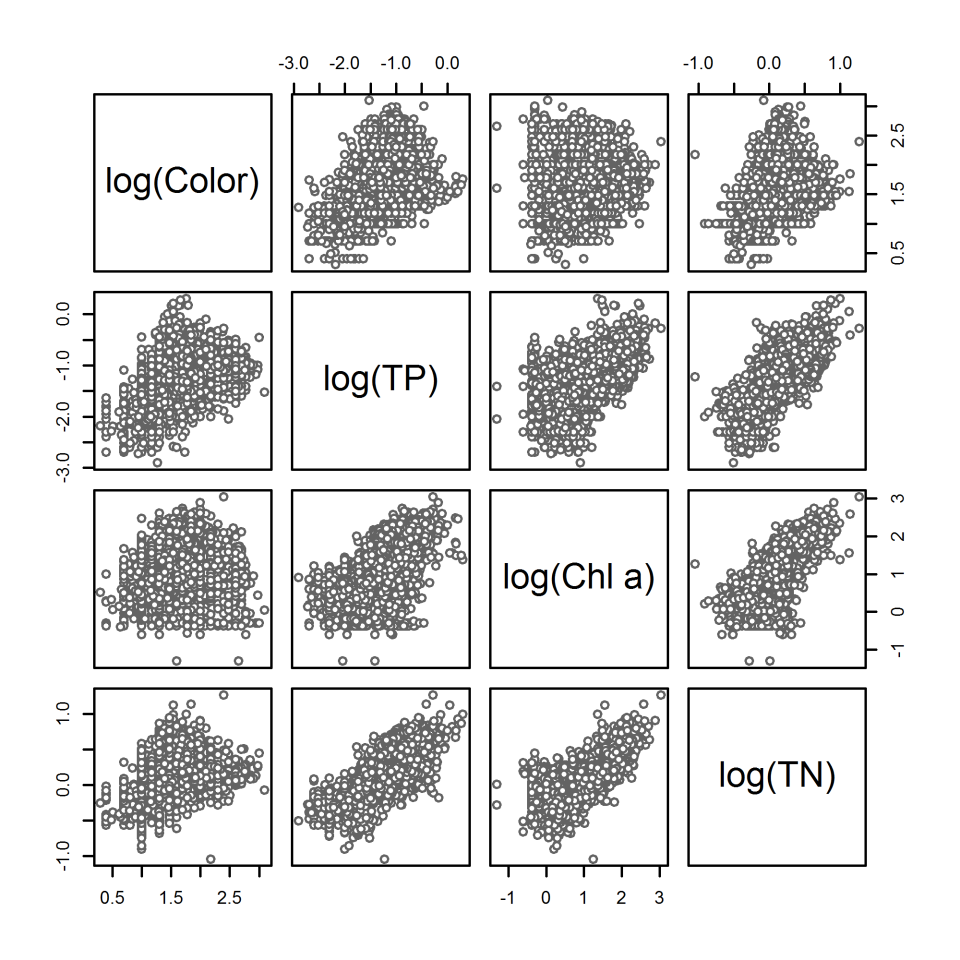
Scatter plots
One of the simplest ways to visualize the relationship between two variables
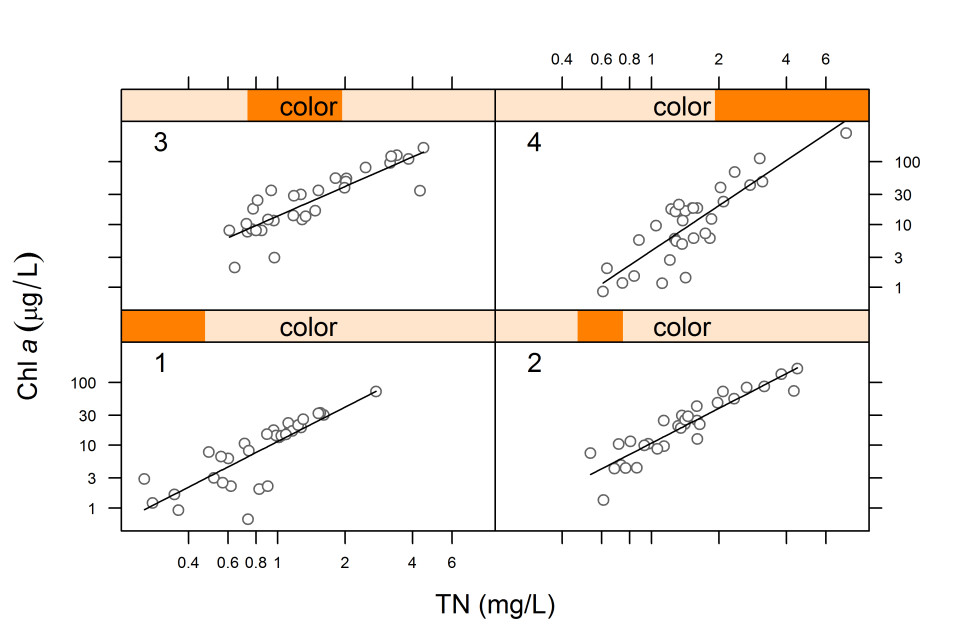
Coplots
An enhancement of scatter plots in which data are first grouped with respect to a third variable, then scatter plots are examined within groups (see Figure 3). This technique is particularly useful for examining the potential effect of different classification variables on the relationship between stressor and response variables.
Numerical methods
- Data summaries: Examining means, standard deviations, ranges, and quartiles of different variables can help identify outliers and suggest appropriate variable transformation. For example, measurements for nutrients such as TN or TP often need to be log-transformed to reduce the skewness in their distributions.
- Correlation analysis: Calculating the correlation coefficients between different pairs of variables can supplement insights gained from examining scatter plots. Strongly correlated variables might need to be included in subsequent analysis.