
Dioxins
This chemical profile focuses on releases of dioxin and dioxin-like compounds.
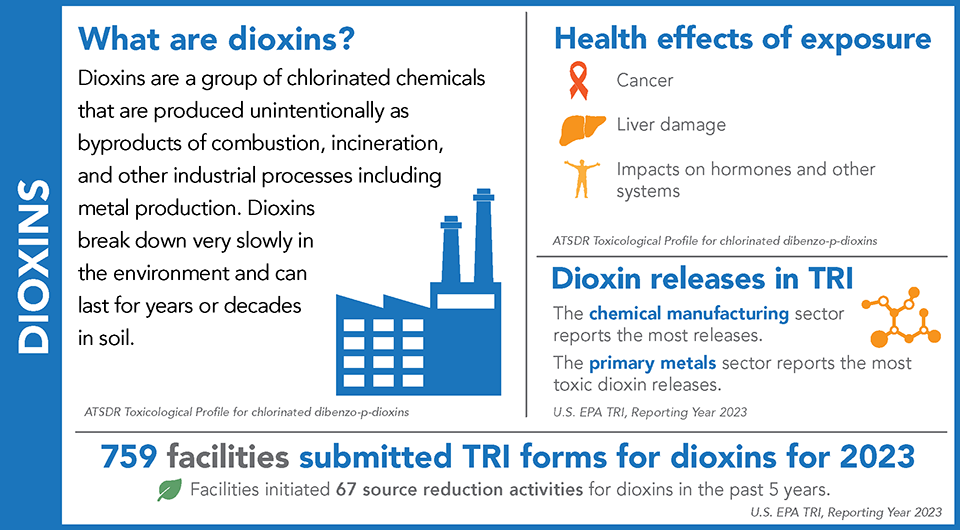
Dioxin and dioxin-like compounds (“dioxins”) are a group of chemically-similar compounds that persist in the environment and bioaccumulate in the food chain. They are typically produced in very small quantities but are toxic at much lower concentrations than many other chemicals. Therefore, dioxins have a lower reporting threshold and are reported in grams instead of pounds.
This map shows the locations of the facilities that reported dioxins to TRI for 2023, sized by their relative release quantities. Click on a facility for more details on its reporting.
Click on any one of the locations on the map to see detailed information.
View Larger Map
Toxic Equivalent Factor (TEF)
Each individual dioxin is assigned a TEF that compares that compound’s toxicity to the most toxic dioxin in the category.
Toxic Equivalency (TEQ)
A TEQ is calculated by multiplying the reported grams of each compound by its corresponding TEF and summing the results, referred to as grams-TEQ.
Learn more about dioxins at EPA’s Dioxins homepage and ATSDR’s dioxins ToxFAQs.
TRI requires facilities to report data on the 17 individual members of the TRI dioxin and dioxin-like compounds category. While each chemical in the dioxin and dioxin-like compounds category causes the same toxic effects, some cause these effects at lower levels of exposure than others because the chemicals have different toxicities. As a result, one mixture of dioxins can have a very different toxic potency than the same amount of a different mixture.
EPA accounts for the varying toxicities of the different dioxins by using Toxic Equivalent Factor (TEF) and Toxic Equivalency (TEQ) values. TEFs help to understand the toxic potency of each dioxin. TEFs are then used to derive TEQs, which add context to releases of different mixtures of dioxins. TEQs are most useful when comparing releases of dioxins from different sources or different time periods, where the mix of dioxins may vary.
This graph shows the 10-year trend in the quantity of dioxins that facilities released from 2014 to 2023.
From 2014 to 2023:
- Dioxin releases fluctuated over the last ten years. Toxicity equivalents (grams-TEQ) decreased by 50%, indicating that the overall toxicity of dioxin releases decreased even while the quantity released increased. This is due to changes in which dioxins were released.
From 2022 to 2023:
- Dioxin releases doubled (a 58,000-gram increase), driven by one organic chemical manufacturer that reported 89,000 grams disposed in an off-site landfill for 2023.
- Toxicity equivalents (grams-TEQ) increased by 21% while the grams increased by almost 100%. This indicates that releases of the less toxic dioxins increased more than the releases of the more toxic dioxins from 2022 to 2023.
- In 2023, 86% of dioxin releases were disposed of at off-site locations, primarily in landfills. The quantity of off-site transfers is higher in 2023 than in previous years due to a large quantity of off-site transfers reported by one organic chemical manufacturer in 2023.
Dioxins Releases by Industry
The following two pie charts compare the industry sectors that reported the greatest releases of dioxins (in grams) to those that reported the greatest releases of dioxins based on toxicity equivalency (in grams-TEQ).
- The mix of dioxins released varies across industry sectors.
- The chemical manufacturing industry accounted for 90% of total grams of dioxins released, with one basic organic chemical manufacturing facility in this sector accounting for 77% of all dioxin releases for 2023.
- In terms of toxicity equivalents, however, the primary metals sector accounted for 33% and the chemical manufacturing sector for 30% of the total grams-TEQ.
This page was published in August 2025 and uses the 2023 TRI National Analysis dataset made public in TRI Explorer in October 2024.