U.S. flag

An official website of the United States government

Here’s how you know

Dot gov

Official websites use .gov
A .gov website belongs to an official government organization in the United States.

HTTPS

Secure .gov websites use HTTPS
A lock (LockA locked padlock) or https:// means you’ve safely connected to the .gov website. Share sensitive information only on official, secure websites.

    • Environmental Topics
    • Air
    • Bed Bugs
    • Chemicals, Toxics, and Pesticide
    • Emergency Response
    • Environmental Information by Location
    • Health
    • Land, Waste, and Cleanup
    • Lead
    • Mold
    • Radon
    • Research
    • Science Topics
    • Water Topics
    • A-Z Topic Index
    • Laws & Regulations
    • By Business Sector
    • By Topic
    • Compliance
    • Enforcement
    • Guidance
    • Laws and Executive Orders
    • Regulations
    • Report a Violation
    • Environmental Violations
    • Fraud, Waste or Abuse
    • About EPA
    • Our Mission and What We Do
    • Headquarters Offices
    • Regional Offices
    • Labs and Research Centers
    • Planning, Budget, and Results
    • Organization Chart
    • EPA History

Breadcrumb

  1. Home
  2. TRI National Analysis
  3. Chemical Profiles

Lead

This chemical profile focuses on releases of lead and lead compounds.

Trina Chemical Profile: Lead

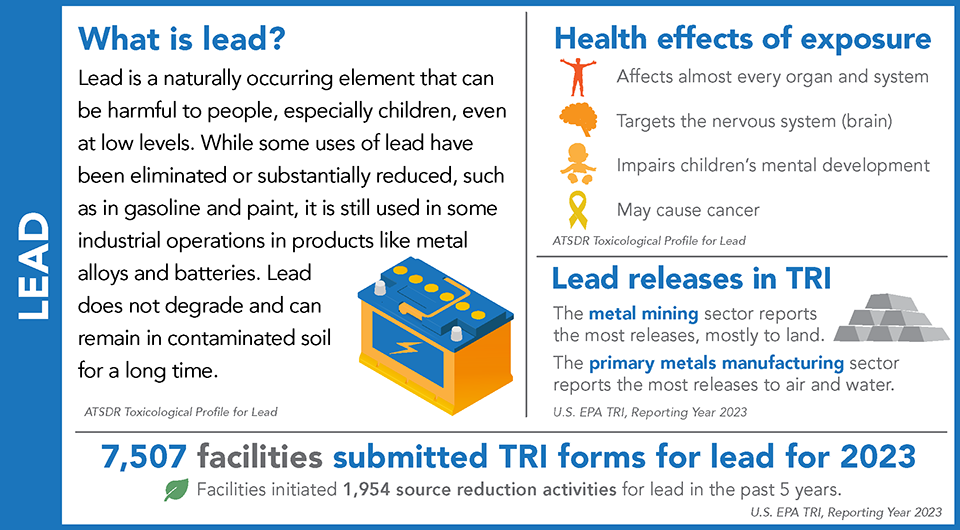
Facilities report waste management of both lead and lead compounds to TRI. For TRI, “lead” only includes elemental lead, while “lead compounds” includes lead that is part of another chemical substance. Facilities may report lead compounds separately from lead, but the two are combined and referred to simply as “lead” in this analysis.

This map shows the locations of the facilities that reported lead to TRI for 2023. The dot size represents relative release quantities. Click on a facility for more details on its reporting.

Click on any one of the locations on the map to see detailed information.
View Larger Map


Each year, EPA receives more TRI forms for lead than for any other chemical. This graph shows the 10-year trend in lead disposed of or otherwise released by facilities in all TRI reporting industry sectors.


Note: The 2023 National Analysis dataset, released in October 2024, included data from one facility that erroneously reported tens of thousands of pounds of lead releases to air. That facility is not included in this chart.

Learn more about lead

Visit EPA’s lead homepage for more information about lead and EPA’s actions to reduce lead exposures.

Visit the Agency for Toxic Substances and Disease Registry’s ToxFAQs for lead to learn more about the effects of lead exposure and what you can do to prevent it.

From 2014 to 2023:

  • Total releases of lead fluctuated between 2014 and 2023.
  • Land disposal by metal mines drives annual lead releases. For 2023, metal mines reported 93% of all releases of lead, almost all of which was disposed of to land.

From 2022 to 2023:

  • Lead releases: 170 million pound increase (+33%), driven by a 185 million-pound increase in on-site lead disposal at metal mines.

This graph shows the 10-year trend in lead disposed of or otherwise released but excludes quantities reported by the metal mining sector.


Note: The 2023 National Analysis dataset, released in October 2024, included data from one facility that erroneously reported tens of thousands of pounds of lead releases to air. That facility is not included in this chart.

From 2014 to 2023:

  • For sectors other than metal mining, total releases of lead fluctuated. These changes were driven largely by releases reported by the primary metals and hazardous waste management sectors.

From 2022 to 2023:

  • For sectors other than metal mining, lead releases decreased by 14 million pounds (-23%). This decrease was driven by the hazardous waste management sector. Large changes are common in this sector because hazardous waste facilities manage waste generated by other sectors, quantities of which can vary from year to year.

Lead Air Releases

This graph shows the 10-year trend in air releases of lead.


Note: The 2023 National Analysis dataset, released in October 2024, included data from one facility that erroneously reported tens of thousands of pounds of lead releases to air. That facility is not included in this chart.

From 2014 to 2023:

  • Air releases of lead: 137 thousand pound decrease (-31%).
  • The primary metals sector, which includes copper smelting and iron and steel manufacturing, released the largest quantities of lead to air. This sector has also been a main driver in the decline of lead air releases from 2014 to 2023.
  • Lead air releases have decreased in most other sectors.

From 2022 to 2023:

  • Air releases of lead: 20,000 pound decrease (-6%).
  • In 2023, the primary metals sector accounted for 36% of lead released into the air.

Previous Next

This page was published in August 2025 and uses the 2023 TRI National Analysis dataset made public in TRI Explorer in October 2024.

TRI National Analysis

  • TRI Program Home
  • Introduction
    • TRI Data Considerations
  • Pollution Prevention
    • Source Reduction Activities
    • Source Reduction Activities by Chemical & Industry
    • Measuring the Impact of Source Reduction
    • Green Chemistry & Engineering Activities
    • Reported Barriers to Source Reduction
    • Source Reduction Activities by Parent Company
  • Waste Management
    • Trends in Waste Management
    • Waste Management by Chemical & Industry
    • Non-Production-Related Waste Managed
    • Waste Managed by Parent Company
  • Releases of Chemicals
    • Trends in Releases
    • Releases by Chemical & Industry
    • Air Releases
      • Air Releases by Chemical & Industry
    • Water Releases
      • Water Releases by Chemical & Industry
    • Land Disposal
      • Land Disposal by Chemical & Industry
  • Chemical Profiles
    • Lead
    • Mercury
    • Dioxins
    • Ethylene Oxide
    • Carcinogens
    • PFAS
  • Sector Profiles
    • Manufacturing Sectors
      • Manufacturing Waste Management Trend
    • Chemical Manufacturing
      • Chemical Manufacturing Waste Management Trend
    • Automotive Manufacturing
      • Automotive Manufacturing Waste Management Trend
    • Wood Products Manufacturing
      • Wood Products Waste Management Trend
    • Electric Utilities
      • Electric Utilities Waste Management Trend
    • Federal Facilities
      • Federal Facilities by Industry
      • Waste Management by Federal Facilities
  • Where You Live
    • EPA Regions
    • States & Metropolitan Areas
    • Watersheds
    • Tribal Communities
  • TRI Connections
  • Data Dashboard
  • National Analysis Archive
Contact Us About the TRI National Analysis
Contact Us About the TRI National Analysis to ask a question, provide feedback, or report a problem.
Last updated on August 20, 2025
  • Assistance
  • Spanish
  • Arabic
  • Chinese (simplified)
  • Chinese (traditional)
  • French
  • Haitian Creole
  • Korean
  • Portuguese
  • Russian
  • Tagalog
  • Vietnamese
United States Environmental Protection Agency

Discover.

  • Accessibility Statement
  • Budget & Performance
  • Contracting
  • EPA www Web Snapshot
  • Grants
  • No FEAR Act Data
  • Plain Writing
  • Privacy
  • Privacy and Security Notice

Connect.

  • Data
  • Inspector General
  • Jobs
  • Newsroom
  • Regulations.gov
  • Subscribe
  • USA.gov
  • White House

Ask.

  • Contact EPA
  • EPA Disclaimers
  • Hotlines
  • FOIA Requests
  • Frequent Questions
  • Site Feedback

Follow.